|
|
This project has received funding from the European Union’s Horizon
2020 research and innovation programme under grant agreement No 871498
|
To add support in LibreOffice for sparklines, we need to first read them into the LibreOffice data model, but the data model for sparklines doesn't yet exists, so we need to create that first. Sparklines are defined for one cell, but multiple sparklines can be grouped together into a group, which shares the same properties for rendering the sparkline. The unique data that is defined only for one sparkline is the data range, that a sparkline will use for rendering.
With this in mind we create a data model that consists of classes: SparklineCell -> Sparkline -> SparklineGroup, where SparklineCell is "added" to a cell and just holds a pointer to the Sparkline.
There are 3 types of sparklines supported in OOXML: line, column and stacked. The "line" type renders a line for the data range, "column" type shows each data point as a column bar, and "stacked" is a win/loss column bar, that shows if the data is positive or negative.
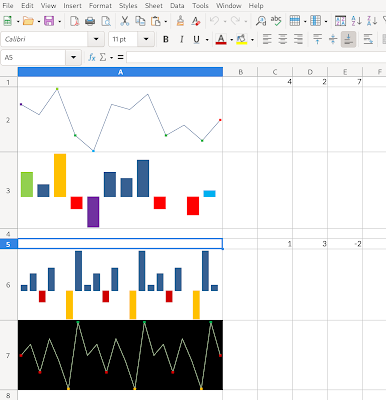 |
| Figure 1: "Line" and "Column" sparklines in LibreOffice Calc |
There are many properties for a sparklines that can be customised by the user. These are some of them:
- First Point, Last Point - if enabled, it shows the first and/or last point in different custom color (See Figure 1 - "column" sparkline in A3 cell, first is green and last is blue).
- High Point, Low Point - if enabled, it shows the highest point and/or lowest point in different custom color (See Figure 1 - "column" sparkline at A6 cell, low points are in yellow).
- Negative Point - if enabled, it shows the negative points in a different custom color (See Figure 1 - "column" sparkline at A6 cell, negative points are red).
- Markes - if enabled, it shows the markers (only for "line" type) (See Figure 1 - "line" sparkline at A2 cell - shows markers).
- Axis - if enabled, it shows the axis line
- Right-to-left - if enabled, it shows the data in the right to left order
- ...
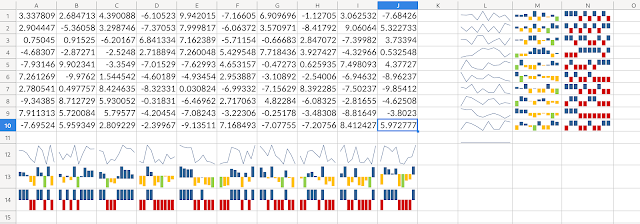 |
| Figure 2: Horizontal and vertical sparklines of all 3 types |
Once we have the data model ready we can render the sparklines in the cell area. In Calc this currently looks like in Figure 1 and Figure 2. The Figure 1 shows examples of "line" and "column" sparklines (2 of each), and Figure 2 shows all three types for a block of (random) data (horizontally and vertically).
Currently the code for this is in a feature branch (feature/sparklines), but is in the process of being up-streamed to master. The feature will be available in LibreOffice 7.4.
Next step
With the current implementation, we can open a XLSX document with sparklines and they will be rendered in LibreOffice Calc, but we can't save the document and preserve the sparklines yet. It is also not possible to create new sparklines from scratch or change any of the properties yet (there is no UI for it). ODF support is also missing.
This things will be implemented in the following weeks, and when they are ready, I will blog about them again.
Great this feature is also available in Calc. ;-)
ReplyDelete