Wednesday, March 24, 2021

Built-in "Xray" like UNO object inspector – Part 3

DevTools implementation has been completed and this is the third and final part of the mini-series. The focus of this part is on the object inspector, but I have also improved or changed other DevTools parts, so first I will briefly mention those.

New menu position


Figure 1: Development Tools location in the menu

The position in menu has changed from "Help / Development Tools" to "Tools / Development Tools". The new position fits better as it is near the position of macro editor and they go hand in hand with each-other.

Updates to the document model tree view


Figure 2: Document model tree view and "Current Selection" toggle button

The left-hand side document model tree view has been changed to use the same approach than the object inspector tree view uses, where the object attached tree view (in this case DocumentModelTreeEntry) has all the behavioural logic for a specific tree view node. This makes it easier to manipulate the tree view and add new nodes (if necessary).

In the document object tree view I have added a top toolbar with "Refresh" (icon) button and I changed the existing “Current Selection” button to a toolbar toggle button, so it looks more consistent as the is only the toolbar now (see figure 2).

In Writer, each paragraph tree view node now has text portion child nodes (as shown in figure 2), to make it possible to quickly inspect all the individual parts of a paragraph.

The object inspector tree view

Figure 3: Top toolbar and tab bar in object inspector


The object inspector shows various information about an object. Each object has a implementation class, which is always shown for the current object (see figure 3).

The other information that the object inspector shows are divided into four main categories:
  • "Interfaces" - the interfaces that the current object implements
  • "Services" - the services that the current object supports
  • "Properties" - the properties of the current object
  • "Methods" - the combined methods that can be called on the current object
On the user interface, the categories are divided with a tab bar (see figure 3). Each tab represents a different categories. The tabs are filled on "entry" - when the user clicks on the tab.

In the code the tabs and tree views are all handled by the ObjectInspectorTreeHandler and the hierarchy of objects attached the tree view that implement the ObjectInspectorNodeInterface (see include/sfx2/devtools/ObjectInspectorTreeHandler.hxx). 

The two major categories are "Properties" and "Methods", which I describe in more detail next.

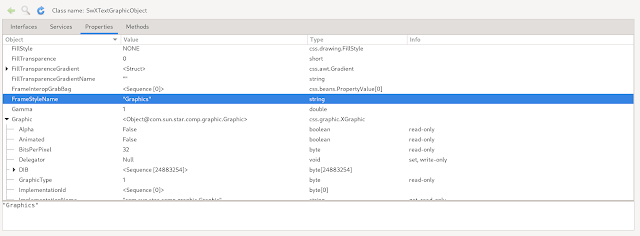
Properties

Figure 4: Object inspector "Properties" tab


There are three types of properties of an object:
  • Properties accessible view XPropertySet.
  • Properties defined as an attribute (marked "[attribute]" in IDL). 
  • Pseudo properties defined by a get and set method. 
All the three types are represented in the properties tab and can be identified by the "Info" column. Attribute properties have an "attribute" flag, pseudo properties have either a "get", "set" or both flags. If neither flags exists, it represents a property that is from XPropertySet. 

In the tree view there are four columns for each property - "Name", "Value", "Type" and already mentioned "Info". The "Name" of the property is always available, but it is possible that two properties have the same name (because of multiple property types). The "Value" shows the value of the property, which is converted to the string, if this is possible (it should be if the property is basic), otherwise a representation string is created. The representation string for objects shows the implementation name ("<Object@SwXTextRange>"), for sequences it shows the size ("<Sequence [5]>") and for structs it just mentions the type ("<Struct>").

A node in the “Properties” tree view can be expanded (if offered) so it is possible to recursively inspect the the objects further. In case the property is a struct, it shows the struct members, and if it is a sequence, it shows the indices each object has in the sequence.

There are special properties, which names start with "@". This are added for convenience, so it is possible to inspect objects, that implement XIndexContainer, XNameContainer or XEnumeration interfaces. When such an object is found, the entries gathered using those interfaces are added to the tree view, and are prefixed with "@". For example "@3" (XIndexContainer)   "@PageStyles" (XNameContainer or XEnumeration). The type of the special property is written in the "Info" column ("index container", "name container" and "enumeration" flags). Note that this functionality is not present in Xray or the Macro editor's debugger, but was added for convenience.

Figure 5: "Properties" tab and the text view

On the bottom of the "Properties" tab there is a text view, which shows the full value of the current selected property. In the tree view, the value shown is always using a short form (shortened to 60 chars with new-line characters removed) to not make the tree view too wide. The full value therefor is written in the text view, where it can be inspected in full and has also a working copy/paste (see figure 5).

Object Stack

Related to the "Properties" is the object stack. It is possible to select an object in the tree view and inspect the object (either using the context menu or the toolbar "Inspect" action). In this case the object in the object inspector will change to the selected one. This is convenient when you are only interested in one object down in the tree view hierarchy and want to inspect only that. In that case the previous object will be added to the stack, and can be returned to with hitting the "Back" button in the toolbar.

Note that going to another object (not using "Inspect" action) will always remove the object stack. 

Methods

Figure 6: Object inspector "Methods" tab


The "Methods" tab contains a tree view that shows all the methods, that can be called for the current object. Each method is represented by four columns (see figure 6):
  • "Method" - name of the method
  • "Return type" - the return (simplified) type of the method
  • "Parameters" - list of input parameters, where each one lists the direction ("in", "out" or "in/out"), the parameter name and the simplified type 
  • "Implementation Class" - class/interface where the method is implemented
Currently the types of parameters and return types are simplified, with only basic types, "void", "any", "sequence" and "object" that represents all the objects and the type of the object isn't written. The reason for this is to make it easier to read. 

Future ideas

There are many improvements that can still be made, but aren't included in the current implementation. 

I think it would be quite convenient to have the ability to open a object inspector in mode-less dialog separate to the DevTools, just to quickly look up a property. 

Another big upgrade would also be the ability to change values of basic types for the properties and structs, so it is possible to quickly see what effect the change would have. Similar to changing property values is to call methods with defining the parameters, but only if the parameters are basic types.

My initial vision of DevTools was not that it will be only one tool (object inspector), but more tools just like the development tools in the browser, so I'm sure there will be more useful things integrated over time.

I think there are a lot of ideas you may also have, so please tell me if you have a good one. Of course if you find something that is not working as expected, please let me know.

Credits

Many thanks to TDF and users that support the foundation by providing donations, to make this work possible.

Monday, March 1, 2021

Built-in "Xray" like UNO object inspector – Part 2

Since my last blog post I've been continuing the work on DevTools and since then a lot of things have progressed. Point & click has been implemented and the object inspector view has been greatly improved to show current object’s properties and methods. In this part I will mainly talk about the point & click and a bit about the current state, and in the next blog I will extensively talk about the object inspector.

Point & click

Figure 1: Current selection button


The idea of this functionality is to provide a way to inspect selected objects in the document, for example an image or a shape. For this, I have implemented a selection change listener (sfx2/source/devtools/SelectionChangeHandler.hxx), whose purpose is to listen to the selection changes that happen in the document and store the latest selection object. It is started when the DevTools docking window is instantiated and shown. I have added a new toggle button “Current Selection” (see Figure 1) to the UI. When the button is selected, it automatically shows the current selected object (gathered with the selection change listener) in the object inspector. 

Figure 2: Current selected shape's properties shown in the object inspector

In the example shown in Figure 2, we can see the shape is selected in the document and its properties are shown in the object inspector. If the "Current Selection" button wouldn't be toggled, then the document top-level object would be shown in the object inspector or the selected object in the DOM tree view.

While the "Current Selection" button is toggled, selecting any object in the DOM tree view (left-hand side tree view) has no effect, however if the current selected object is also present in the current DOM tree view, it will be selected. Note that if the object is not present in the tree, it won't be selected, because the DOM tree view will not force creation of on-demand object because of performance considerations.

Figure 3: "Inspect Object" command in "Customize" dialog 


In addition to showing the selected object, I have added a UNO command named “Inspect Object” (.uno:InspectSelectedObject), which can be added to context menus for objects (See Figure 3). The purpose of this command is to provide a way to open the DevTools docking window and automatically show the current selected object. If a user regularly uses the object inspector, this may be a more convenient way for them to access DevTools. Note that by default the command isn't added to any context menu, this is up to the user. However, if there will be demand to add this to context menus, it can be easily added. 

Figure 4: "Inspect Object" context menu entry on a shape object

The example in Figure 4 shows the context menu of a shape object, where the selected entry is the added "Inspect Object". 

From the implementation standpoint, it was necessary to move the whole DevTools from svx to sfx2 module. This was mainly necessary to get .uno:InspectSelectedObject to work, because we need to signal to DevTools that we want to show the current selection and not the document root in the object inspector. Because the svx depends on sfx2 module, it is not possible to access svx from sfx2 (only the other way around). 

Improvements to object inspector

The object inspector was previously a single tree view only, which had services, interfaces, properties and methods categories as root tree entries. This has now been changed so that the categories are now pages in a tab view, and each category has its own tree view (can be seen in Figure 2). The main problem with one tree view is that columns for each of the categories are different. For example, the properties category has object, value and type categories but the same columns make no sense for methods (which has return type and input parameters). 

For methods it now shows the method name, return type and parameters. The types are currently simplified types, which are easier to read (instead of exact type name of the object it just writes "object"), but the user will want to know the exact type too, so this is a WIP.

For properties it shows the type and value of the property, and it is possible to expand a property if the type is a complex type (object, struct) so it lists nested properties. If the value is an enum, then we get the name of the enum value automatically and show the name instead. 

Support for sequences was also added, so the sequence can be expanded and a list of indices and values is presented. If the current object supports XNameAccess or XIndexAccess, the names and indices are added into the property list, so the user can navigate to those. 

With this additions, it is already easier to inspect objects than it previously was using the Xray tool, and I'm sure it will get even better when it is finished. 

Next steps

The object inspector is already in a very good shape so I encourage everyone to try it and give feedback, what can be improved, changed or added - especially if you use Xray or MRI regularly. 

For the next steps the major focus will be to fix a couple of bugs and crashes (mainly due to missing checks if objects are available), work on the UI, object stack (so it is possible to go back to the previous object) and finalizing all the features of the object inspector. 

Credits

Many thanks to TDF and users that support the foundation by providing donations, to make this work possible. 

To be continued...